
Marteloscopes are a key tool of the Integrate Network Multi-Donor-Trust-Fund. Since the start of Integrate + in 2013, the network’s forerunner project*, this didactic training tool has expanded to more than 270 sites in 27 countries, enabling the recording of more than 100,000 individual tree observations. This number is continuously increasing.
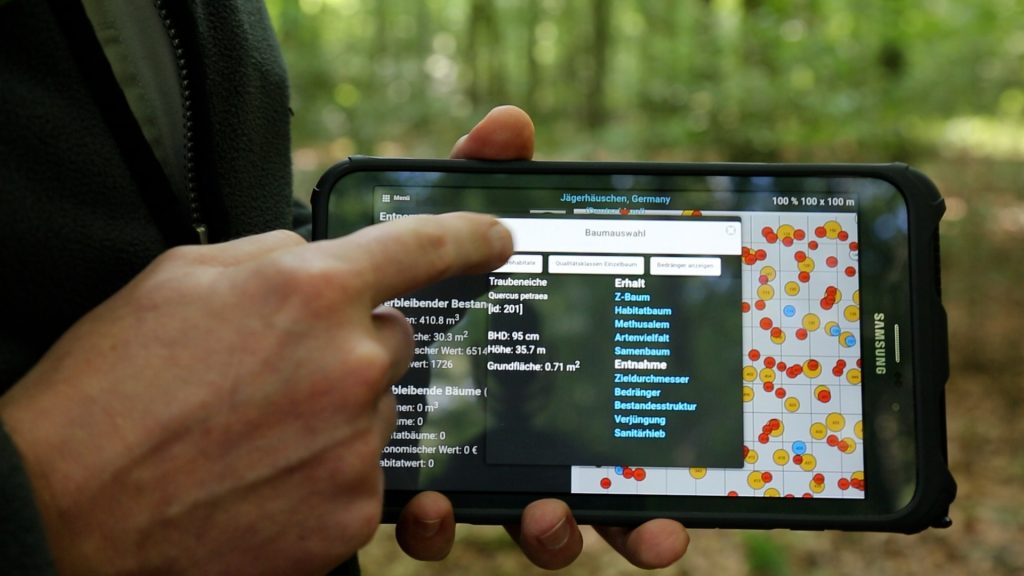
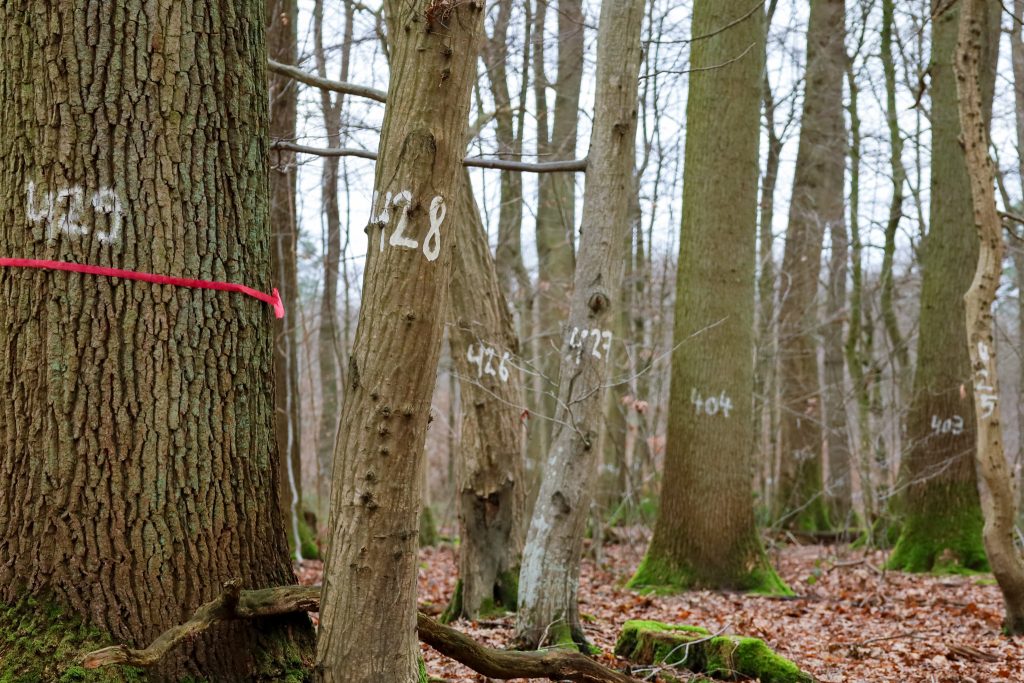
In each marteloscope, every tree is carefully measured and documented. The recorded parameters, such as tree height and diameter, tree species, exact location within the plot, tree microhabitats and wood quality, provide valuable insights into the forest’s structure. Both the economic and ecological value of each tree is calculated, with the latter based on the presence of tree microhabitats. During training exercises in these marteloscopes, participants can perform virtual management interventions and explore the impact their decisions would have on diverse forest stands. This immersive exploration happens through an interactive software, where users can record their action and retrieve results.

PC : Andreas Schuck
Curious to know more ?
To allow for a closer look and deep dive into the existing data behind all the marteloscopes, we created a new interactive map that uses the geospatial data from the Integrate Network Database. Whether you are a journalist, policymaker, forester, forest owner, scientist, or student, our map allows you to not only access this data but to get a full view of the extent of data for all 27 European countries that host marteloscope sites. You can zoom into the seven biogeographical regions or go all the way down to each of the more than 100,000 recorded trees. In this way, the marteloscope data can be explored and viewed from diverse perspectives.
Click on the map below to take a closer look.

The significant expansion of the incoming data over the years reflects a growing interest among forest practitioners, nature conservation managers, silviculture trainers, universities, as well as other educational centres to use marteloscopes for training, education and knowledge exchange.
With the growing number of marteloscope sites, the database of individually recorded trees continues to evolve, and so does its potential for use in research.
Which tree species are important for developing microhabitats? Does tree species composition and tree diameter have an impact on them? What kind of diameter distributions can we observe in the different sites or biogeographic regions? What can we observe about the tree height/diameter ratio? Many questions and observations emerge from taking a closer look at the data.
While the data is not overall representative for the seven biogeographical regions, (due to the non-systematic dispersal and location of plots) still each tree was measured using the same methods – meaning, with the same set of parameters consistently recorded for all trees. This consistency may allow the former listed research questions to be addressed as well as encourage the use of this data within other fields of research and practice.
To visualize the dataset trends by biogeographic region an in-depth analysis was performed, resulting in 72 graphs that uncover and illustrate what lies hidden in the data. The aim with the analysis is to spark new interest for the data and encourage its use, both in research and practice. To give you a first glimpse at the data, we selected three illustrative graphs.

Graph 1: Distribution of tree types in Europe by diameter class
The first graph illustrates tree genus groups (groups of related tree species), and diameter distribution in Europe as available in the marteloscope database.
A common pattern across all regions here is the presence of pioneer species such as birch (Betula), but also maple (Acer), pine (Pinus), and hornbeam (Carpinus), mainly in the smaller diameter classes. Oak (Quercus) and fir (Abies), on the other hand, are more common in the larger diameter classes, representing mature trees. Beech (Fagus) and Spruce (Picea) are found consistently across all diameter classes.
The distribution of genera by diameter class can also provide insight into forest management practices. For example, pine trees are often harvested when they reach around 40 cm in diameter, as they become already economically valuable at that size.

Graph 2: Tree microhabitats proportions by Biogeographic region
Tree microhabitats are small ecologically important features found on trees. They can be, for example, tree cavities, cracks, nesting sites, fruiting bodies of fungi**, mosses and lichens, growth deformations, and many more. A catalogue of tree microhabitats was used to record such structures and can be found here in 17 languages, for those interested in learning more about tree microhabitats.
While the total number recorded varies from site to site, interesting patterns emerge in the distribution of tree microhabitats across Europe’s seven biogeographic regions:
Growth deformations were for instance commonly recorded in the Black Sea region, while cavities appeared more frequently in the Mediterranean. Dead wood features were especially prominent in the Pannonian region and Epiphytes (such as for example mosses and/or lichens) were abundant in the Atlantic forests.
Together, these observations offer a glimpse into the ecological diversity and forest structures of each region

Graph 3: Tree slenderness distribution across the Biogegraphical regions
Slenderness is the ratio of a tree’s height to its diameter. It is a common measure in forestry and gives an indication on how trees grow and how stable they are. Slenderness can offer insights about a tree’s exposure to disturbances or stress, like wind storms, snow breakage, heat or drought.
For example, trees in the Mediterranean region tend to be shorter and thicker, showing lower slenderness values. In contrast, trees in the Boreal and Continental regions are generally taller and thinner which makes them more vulnerable especially to wind damage.
Those parameters can find use for research relating to forest vulnerability.
For a more in-depth analysis that uncovers and illustrates what lies hidden behind this data, you can now access and read a full in-depth article, written by Nele Römer, Andreas Schuck and Sergey Zudin, published here.
*The network started with the project “Establishing a European network of demonstration sites for the integration of biodiversity conservation into forest management (Integrate+; 2013-2016)”, had multiple follow up projects and is now under the auspices of the ”Integrate Network Multi-Donor-Trust-Fund (2022-ongoing)”.
**Fruiting bodies of fungi are multicellular structures which contain spores, dispersed for reproduction. Mushrooms are a familiar example of a fruiting body.